Nowadays seismology mainly focuses on digital data acquisition gathered by seismometers installed in a seismic network and the detection of earthquakes. Earthquakes, however, happened long before we were able to measure them in the instrumental era. By gathering and mapping witness’ reports on felt earthquakes, the impact of an earthquake can be reliably mapped and the magnitude and depth of historical earthquakes can be estimated based on the distribution of the felt reports. Usually the German mathematician P.N.G. Egen is credited for the development of the first modern intensity scale based on the perception of 28 February 1828 Ms ~4.6 earthquake near Jauche in Belgium. Later pioneering work of Nicholas Ambraseys in the 1970ies showed the enormous value of studying historical earthquakes. Read more about this on our page Historical Seismology.
Since 1932, after the ML 4.7 Uden earthquake, when a felt earthquake occurs, the Royal Observatory of Belgium sends out national earthquake inquiries to each Belgian municipality to construct an intensity map of the felt area. Based on the responses, an earthquake intensity value is assigned to each municipality resulting in an Communal Intensity Map. The first success of macroseismology in Belgium was shown by Somville (1939) who gathered the felt reports of the largest instrumentally recorded earthquake on the Belgian territory: i.e. the Zulzeke-Nukerke (near Oudenaarde) 11 June 1938 Ms 5.0 earthquake. The shape of the damage distribution was determined by a statistical study of fallen chimneys. Remarkably, the damaged area had an elliptical shape: in an E-W direction macroseismic intensities of VI and VII were reported in an area extending 160 km, whereas in a N-S direction intensity VI or more has only been reported from an area not extending 50 km (Figure 1).
Damage at a site is not only dependant of the seismic source, but is also a function of the path, the distance from the source and the potential amplifications or attenuations due to the local geology, i.e. the site effect. Investigations on strong ground motions generated by earthquakes provide evidence that the local geological structure of a site, especially the presence of soft sedimentary layers, can modify the characteristics of seismic shaking at the surface. Hence, interpreting macroseismic maps requires a comprehensive understanding of the local geology. In an E-W direction in central Belgium, the basement rocks of the Brabant Massif (an old rock massif extending from our regions to London) are at shallow depth: this has caused local ground motion amplification for the 1938 earthquake (Nguyen et al., 2004) and also for other recent events.
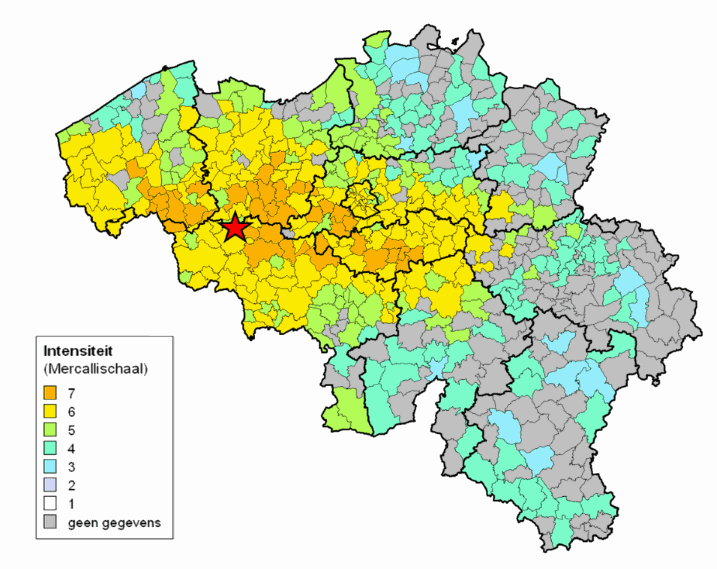
Figure 1: Macroseismic map of the 1938 Zulzeke-Nukerke earthquake constructed from official communal reports. Note the elliptical shape of the distribution of felt events in central Belgium: a distribution that can be explained by the shallow depth of the Brabant Massif in the affected region. After Somville (1939).
The ML 5.8 Roermond earthquake (NL) at 03h20 (local time) on 13 April 1992 was the largest seismic event ever recorded in The Netherlands and one of the largest of the 20th Century in NW Europe. The macroseismic effects were observed in The Netherlands, Belgium, Luxemburg, Germany, France to the Czech Republic, Switzerland, UK and Austria. Substantial damages to buildings were reported in the epicentral area in Roermond. Macroseismic data was acquired by numerous institutions in several countries. An international collaboration, to which also the ROB contributed, resulted in the transfrontier macroseismic map of the Roermond earthquake (Haak et al., 1994).
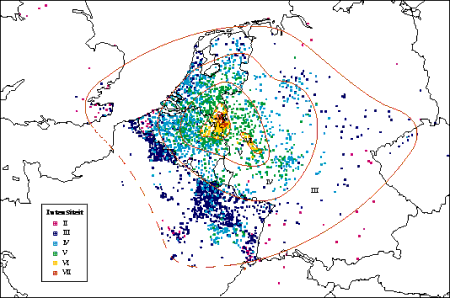
Figure 2: Transfrontier macroseismic map of the Ms 5.4 1992 Roermond earthquake (Haak et al. 1994). Intensity VII was assigned to the Roermond epicentral area.
And then the Internet appeared…
Since 2002 the ROB paper inquiry has been complemented by the online internet « Did You Feel It? » (DYFI) macroseismic inquiry. The questionnaire that is used by the ROB is adapted from the United States Geological Survey (USGS) after DYFI pioneering work by David Wald and colleagues (Wald et al., 1999). The questionnaire has been translated in four languages (French, Dutch, German and English) to cover a wide area. Online DYFI inquiries allow rapid and automatic construction of community internet intensity macroseismic maps with which the authorities and the population can be quickly informed about the damage distribution and felt area of an earthquake. This information is complementary to the recordings by the seismic stations to study earthquakes and their impact in Belgium. In our system macroseismic maps are updated online every 5 minutes (Lecocq et al., 2009).
In 2011, the Erdbebenstation Bensberg (BNS, University of Cologne) joined our web-inquiry. German citizens can now submit their experience of a felt earthquake to the BNS network and based on the responses a Belgian – German macroseismic map is generated in real-time. This transfrontier macroseismic collaboration is a unique concept in the world!
In 2014, we developed an in-house geocoding algorithm to geolocate the submitted addresses of the responses to detailed geographical locations up to the street level or better. In a community macroseismic map, the intensity distribution is often spread inhomogeneously due to the irregular municipality shapes. Since 2015, the intensity of geocoded locations are grouped in equally-sized grid cells. To each grid cell, an intensity is assigned in a GIS environment. This representation (see Figure 5) allows us to map the felt effect in a more homogeneous way than in official communal or community internet macroseismic maps. Because people do not always provide their address, a grid cell map generally does not embody all reports (~80-90% of total data).
Since 2016, the ROB collaborates with the Bureau Central Sismologique Français (BCSF, Université de Strasbourg). Residents of France who felt an earthquake that occurred in France, can still submit their experience to our online system but the data are automatically transferred to the BCSF. This allows a real-time transfrontier intensity evaluation that strengthens the capacity of both institutes to analyse earthquake effects.
Important seismic events
Apart from informing the public and authorities, much science can be done with DYFI inquiries! Given it is not possible to install seismometers everywhere in the country, the human’s perception is a particularly good measuring device for estimating ground motion. Apart from AcceleROB (installing low costs accelerometers in Belgium) DYFI intensity assessment is currently the only tool to provide ground motion velocity from poorly-instrumented regions to engineers. That is why we need your input! Macroseismology allows studying the intensity decay with increasing distance from the earthquake’s epicentre, and understanding how the regional geology or local site effects influence the ground motion experienced at the Earth’s surface.
22 July 2002 ML 4.9 Eschweiler-Alsdorf earthquake (DE)
The Alsdorf event, an earthquake that occurred along one of the normal faults of the Lower Rhine Graben in Germany, gave the opportunity to activate for the first time our online macroseismic survey. To this day, it is still by far the most successful event as 6145 forms were submitted to Seismology.be. At that time only a Belgian intensity analysis was performed with most of the responses coming from Flanders. The highest intensity in Belgium was Intensity IV (EMS-98 scale) until a distance of 45 km from the earthquake’s epicentre. In Belgium intensity decreased westwards. The event was felt at large epicentral distances by people living at the Belgian coast or in the Ardennes (Camelbeeck et al., 2003). Intensities declined more rapidly to the N and NW than to the W and SW.
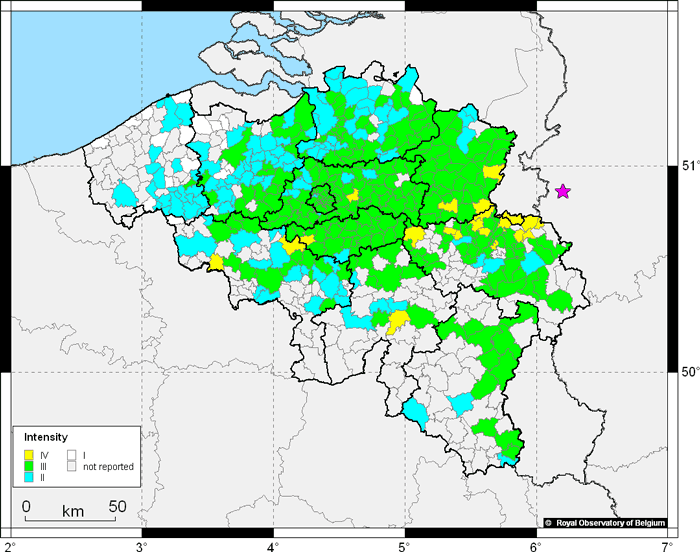
Figure 3: First Belgian web-based macroseismic DYFI map of the 2002 Eschweiler-Alsdorf earthquake. The pink start indicates the epicenter.
2008-2010 Walloon-Brabant Seismic Swarm (BE)
Between 2008 and 2010, 237 earthquakes with magnitudes between ML -0.7 and ML 3.2 occurred south of the small town of Court-Saint-Etienne (Walloon Brabant Province, Belgium) (Van Noten et al., 2015a). During this 2-year period, 60 of the 237 measured events were felt, which resulted in an enormously-rich database of 11040 responses. Remarkably, also very small events and shallow events were perceived by the local population: e.g. 5 responses for the 21 October 2008 ML 0.4 event. The fact that these responses were submitted even before any information was placed on the website makes us confident that this event was really perceived.
The 13 July 2008 ML 3.2 earthquake (1495 responses) was the largest and the most widely perceived of the events. The felt observation with largest epicentral distance was reported at Bressoux (Liège), 71 km E from the epicentre, whereas the farthest report north was only at 42 km (Zemst). The ML 3.2 caused only Intensity III in the epicentral region, which is in agreement with its medium depth (7.7 km). Despite its lower magnitude, the 3 March 2009 ML 2.8 event (1581 responses) and some other events caused Intensity IV in the epicentral area due to its shallower depth (6.3 km) (Van Noten et al., 2015b; Consentino, 2016).
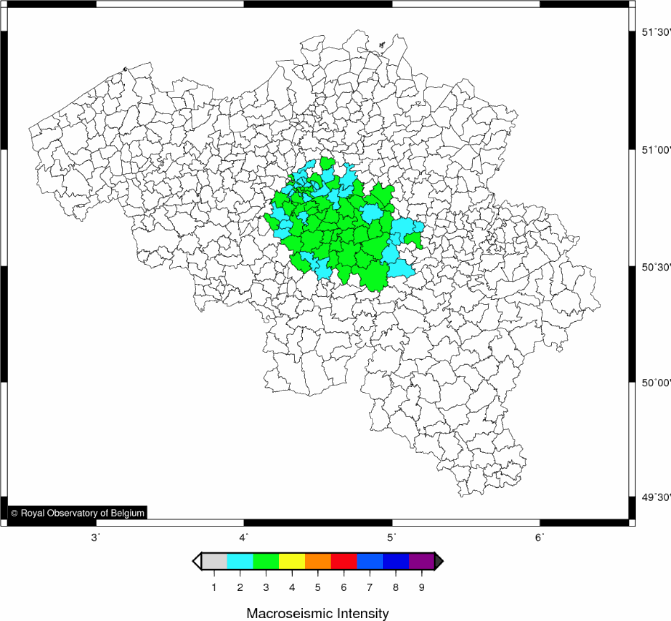
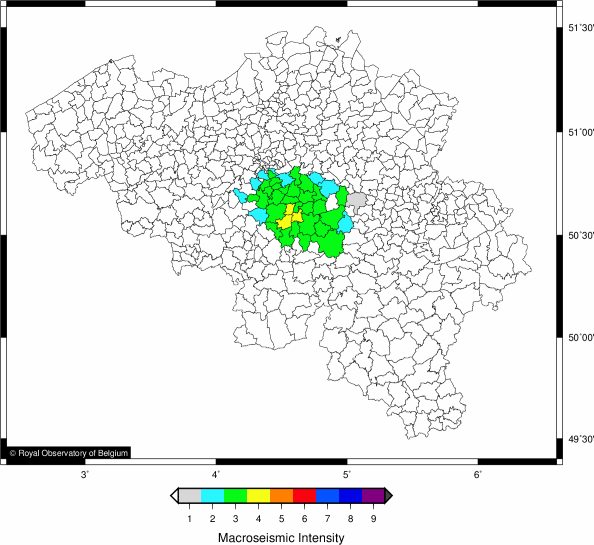
Figure 4: Macroseismic DYFI maps of the 13 July 2008 ML 3.2 (left) and the 3 March 2009 ML 2.8 (right) events. Note the higher intensity but smaller affected area for the ML 2.8 earthquake.
Because of the rather shallow source of the earthquakes and the relatively close distance of the respondents to the earthquake hypocentres, many low-magnitude events have been heard rather than felt. Typical reactions of people reporting these acoustic effects were low frequency sounds, such a ‘boom’ or a deep ‘rumbling’ sound comparable to a ‘thunder’ or a ‘passing truck’. However, also high frequency acoustics such as a loud ‘crack’ or a ‘bang’ were reported. Based on these comments, our online inquiry was extended in 2009 with a sound question in which the reported sound is questioned: the sound scale is currently settled from 0 to 4, with 0 being “no sound”, 1 “light and brief”, 2 “light and prolonged”, 3 “strong and brief” and 4 “strong and prolonged” to hint on the frequency content of the sound.
8 September 2011 ML 4.3 Goch earthquake (DE)
On 8 September 2011 19:02:50 an ML 4.3 earthquake occurred at Goch (DE) at a depth of 10 km on one of the bounding faults of the Venlo Graben. Minor damage was reported in the epicentral area in Germany and The Netherlands. 3113 responses were submitted for this first event after ROB and BNS merged their inquiries.
In contrast to the NE part of Belgium, where the event was barely felt, many macroseismic reports were submitted from central Belgium at larger epicentral distances. This shows that the peculiar shape of the intensity distribution cannot be explained by a traditional geometrical amplitude attenuation alone, relating energy decay to the increasing epicentral distance. In central Belgium, the Brabant Massif is present at the surface in incised river valleys and it gradually deepens towards the north where it is covered by soft sediments. The macroseismic distribution of the 2011 Goch earthquake exemplifies that the area over which this event was felt is related to the thickness of the sediment cover above the Brabant Massif and that sediments have a significant influence on earthquake strong ground motions. To the north of Brabant (Limburg & Antwerp provinces) vibrations are attenuated (damped) due to the thick Cenozoic sediment cover. In central Belgium, the felt shaking is related to an E-W elongated zone with sediment thicknesses that amplify seismic waves in the frequency range to which humans and buildings are susceptible.
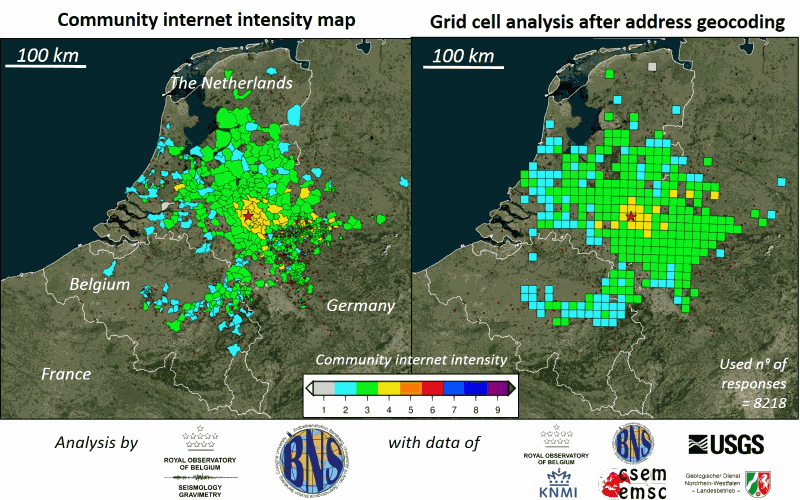
Figure 5: Macroseismic DYFI maps of the 8 September 2011 ML 4.3 earthquake near Goch. The community internet intensity macroseismic map (left) and the geocoded, grid cell intensity map (right) results after merging macroseismic databases from 6 different institutes. This example shows the benefit of transfrontier collaboration in macroseismology. Source: Van Noten et al. (2017).
22 May 2015 ML 4.2 Ramsgate earthquake (UK)
On Friday 22 May 2015 at 03:52:17 (local time) an earthquake with magnitude ML 4.2 occurred close to Ramsgate (UK) at a depth of 15 km. By evaluating other macroseismic inquiries it could be deduced that the event was felt in the UK, in France and in Belgium. The ROB received 1986 responses from people that felt it in Belgium with the farthest report at Liège, more than 400 km away from the epicentre. Similar to the 2011 Goch and 1938 Zulzeke-Nukerke macroseismic distributions, the shallow depth of the Brabant Massif in central Belgium is the main reason why this event was so broadly perceived.
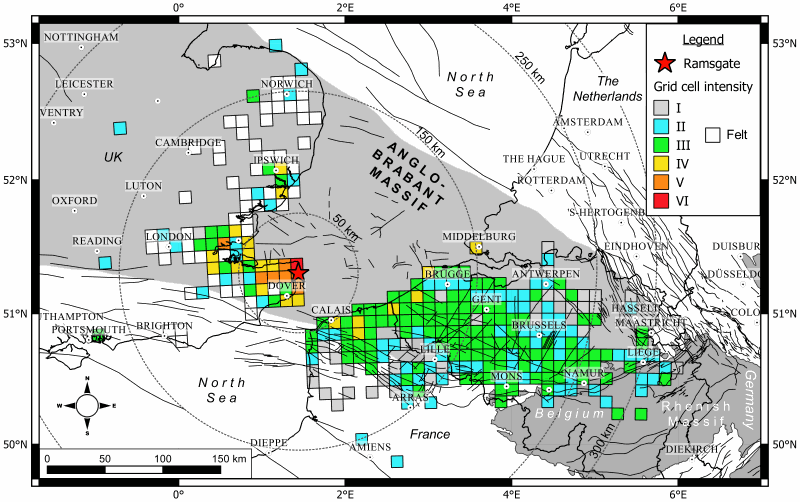
Figure 6: Macroseismic distribution of the 22 May 2015 ML 4.1 earthquake near Ramsgate (UK) showing how the event was perceived in Belgium. The epicentre is indicated by a red star.
Belgian press articles on the Ramsgate earthquake:
- "Ook België beefde even vannacht", De Standaard Avond. 22/05/2015.
- "Aardbeving Kent voelbaar tot in België", Het Laatste Nieuws. 23/05/2015.
- "1.000 mensen voelen aardbeving in België", Het Nieuwsblad. 23/05/2015.
- "Aardbevingen in België: zelden gevaarlijk maar vaker dan je denkt", De Morgen 23/05/2015.
Human events triggering DYFI
F16 Sonic Booms
When loud “bangs” are reported to us, sometimes this is related to a F16 (most frequently used military airplane around Belgium) breaking through the sound barrier. The location can be estimated from the records of our seismic stations and is usually confirmed by the people reporting the event in our online DYFI system. This was for instance the case above Liège on 8 February 2013 (5 testimonies) and above Walloon Brabant on 17 August 2015 (11 testimonies).
Explosions related to construction works or accidents
On 18 February 2011 14:21:20 (Belgian Time) a controlled explosion to demolish a building inside the European quarter in Brussels led 42 people to respond to our inquiry.
On 3 January 2014 13:26:22 (Belgian Time) an accidental explosion occurred near the town of Euskirchen (Germany). From the 301 inquiries, 235 observations were geocoded to the street level or better for those addresses for which the respondents provided their house number. Distribution of individual macroseismic observations proved to be much better suited to interpret the macroseismic spread than if intensity data was grouped per community. Hinzen (2014) concluded that strong directivity of this felt event (all responses came from a northeasterly direction to the blast) was related to source directivity of the air blast, population density, effects of the wind field and topography.
On Sunday 28 February 2016 at 21:36:51 (Belgian time) an explosion related to local construction works in Antwerp mislead people in thinking it was an earthquake. Seismology.be was alerted due to an abnormally-high number of online visitors on the website and through its Twitter account. Rapid seismic data analysis confirmed that was not an “earthquake” effect and this information was spread rapidly through our Twitter and Facebook accounts. 54 people submitted their perception to Seismology.be. The distribution shows that this event has been perceived/heard further to the SW due to a NE wind that evening.
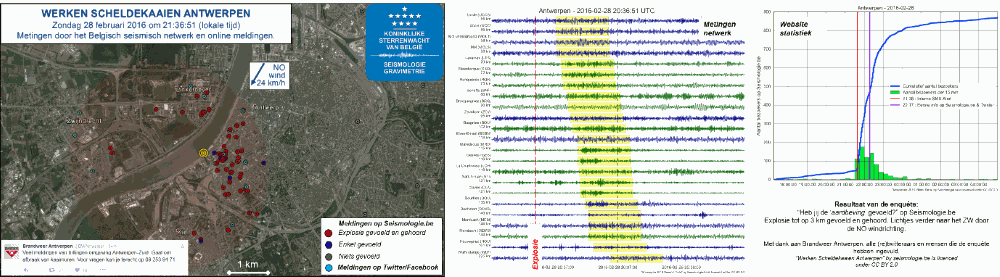
Figure 7: Felt and heard testimonies to the Antwerp construction explosion on 28 February 2016. Sources: Seismologie.be, Twitter and Facebook.
Collaborations
- Erdbebenstation Bensberg – Germany
- Le Bureau Central Sismologique Français – France
- KNMI – The Netherlands
- BGS - UK
- USGS - US
In the media
- In 2016, the DYFI system of the ROB-BNS was in the picture at the EGU. Read the interview on Transfrontier Macroseismology in Europe with K. Van Noten on Geolog: the official blog of the European Geoscience Union.
- In 2016, Bruno C. Consentino, a Brazilian student of the Universidade de São Paulo, analysed the macroseismic and sound data of the 2008-2010 seismic swarm during his Erasmus year at the KULeuven (Ba Thesis). Promotors: K. Van Noten (ROB), M. Sintubin (KULeuven).
References
- Camelbeeck, T., Van Camp, M., Martin, H., Van De Putte, W., Béatse, H., Bukasa, B., Castelein, S., Collin, F., Hendrickx, M., El Bouch, A., Petermans, T., Snissaert, M., Vanneste, K., Verbeiren, R., 2003. De aardbeving van 22 juli 2002 in de Roerdalslenk. Heelal 48, 172-176.
- Consentino, B.C., 2016. Macroseismic intensity assessment of the 2008-2010 Walloon Brabant seismic swarm by a grid cell procedure, Katholieke Universiteit Leuven. B.Sc. Thesis. Promotors: K. Van Noten (ROB), M. Sintubin (KULeuven).
- Egen, P.N.C., 1828. Über das Erdbeben in den Rhein- und Niederlanden von 23 Feb. 1828. Annalen der Physik und der physikalischen Chemie 13, 153–163.
- Haak, H.W., van Bodegraven, J.A., Sleeman, R., Verbeiren, R., Ahorner, L., Meidow, H., Grünthal, G., Hoangtrong, P., Musson, R.M.W., Henni, P., Schenkova, Z., Zimova, R., 1994. The macroseismic map of the 1992 Roermond earthquake, the Netherlands. Geologie en Mijnbouw 73, 265-270.
- Hinzen, K.G., 2014. Seismic Analysis of the Accidental WWII Bomb Explosion in Euskirchen, Germany, on 3 January 2014. Seismological Research Letters 85, 825-835.
- Lecocq, T., Rapagnani, G., Martin, H., De Vos, F., Hendrickx, M., Van Camp, M., Vanneste, K., Camelbeeck, T., 2009. B-FEARS: The Belgian Felt Earthquake Alert and Report System. Cahiers du Centre Européen de Géodynamique et de Séismologie.
- Nguyen, F., Van Rompaey, G., Teerlynck, H., Van Camp, M., Jongmans, D., Camelbeeck, T., 2004. Use of microtremor measurement for assessing site effects in Northern Belgium – interpretation of the observed intensity during the MS = 5.0 June 11 1938 earthquake. Journal of Seismology 8(1), 41-56.
- Somville, O., 1939. Le tremblement de terre belge du 11 juin 1938. Publication de l’Observatoire Royal de Belgique, Imprimerie Duculot, Gembloux, 16 pp.
- Van Noten, K., Lecocq, T., Shah, A.K., Camelbeeck, T., 2015a. Seismotectonic significance of the 2008-2010 Walloon Brabant seismic swarm in the Brabant Massif (Belgium). Tectonophysics 656, 20-38. DOI: http://dx.doi.org/10.1016/j.tecto.2015.05.026
- Van Noten, K., Lecocq, T., Camelbeeck, T., 2015b. The seismic activity in the Walloon Brabant and its relationship with the local and regional geological structure. Final report of BELSPO contract MO/33/028. Royal Observatory of Belgium. 79p.
- Van Noten, K., Lecocq, T., Sira, C., Hinzen, K.-G., and Camelbeeck, T. 2017. Path and site effects deduced from merged transfrontier internet macroseismic data of two recent M4 earthquakes in northwest Europe using a grid cell approach, Solid Earth, 8, 453-477, https://doi.org/10.5194/se-8-453-2017.
- Wald, D.J., Quitoriano, V., Dengler, L.A., Dewey, J.W., 1999. Utilization of the internet for rapid community intensity maps. Seismological Research Letters 70(6), 680- 697.